It
is very common and expected to see a query containing ORDER BY or GROUP BY clause for
displaying or grouping purposes. It is also common that developers use ORDER BY
clause from a habit without considering its necessity. As a result, queries become
slower overtime as the number of records increases.
 |
The Last Supper - by Leonardo da Vinci
Grouping example in Art |
When
a sort operation unable to acquire sufficient memory grant and it cannot be done in the memory and must happen in the tempdb. The heavier
processing load inside the tempdb degrades overall SQL Server performance
significantly. This situation is usually known as “spill to tempdb” or
“spills in tempdb”. I
t
is crucial to identify those sort warnings and avoid them whenever possible.
In
my experience, I have seen ORDER BY/GROUP BY being used on a VARCHAR (8000)
column while retrieving data; even unwisely used on a JOIN clause! Tweaking these
queries is a bit tricky and most of the time it is impossible since the
front-end application or business logic has already been built-in on this criterion. Creating an index
on this column is not possible due to the 900 bytes restriction on an index key
column. So, other than crossing fingers,
there is nothing much to do to resolve the performance issue immediately.
Common Issues:
Following
are some common issues that occur due to the misuse of ORDER BY/GROUP BY
clause:
1. Rapid tempdb data file growth.
2. Increases disk I/O
activities on tempdb and tempdb drive.
3. Introduces lock contention
and escalation.
4. Increases memory grant for sort/hash
operation.
5. Introduces parallel query
plan.
Detecting the Issue:
Detecting
performance issues that arise from sort operation is quite simple and straight
forward. Following are some tips to identify issues:
1. Review the query and
identify columns that are used on ORDER/GROUP clauses.
2. Review the Execution plan
and identify “sort” operators.
3. Identify parallelism
operators that perform the “distribute streams”, ”gather streams” and “repartition
streams” in parallel execution plan.
4. Use SQL Profiler Trace event
“sort warnings”.
5. Extended Event – “sort_warning”
6. Use PerfMom or
sys.dm_os_performance to track “worktables created/sec” and “workfiles created/sec”
To resolve the performance
Issue:
To resolve
performance issues that occur from a sort operation, a couple of actions can be
taken as follows:
1.
Review the necessity of a sort
operation in the query.
2.
Try to perform a sort operation
in the front-end.
3.
Normalize the database schema.
4.
Create single or multi-column
indexes.
5.
Apply filters on indexes.
6.
Use TOP (n) when there is an “ORDER
BY”, if possible.
7.
Put more filters in the query to
touch less data.
8.
Update distribution statistics.
Observing the behavior:
To
observe the common issues with ORDER BY/GROUP BY operations, let’s create a
database, table and a simple select statement against 500,000 records.
CREATE DATABASE testDB
GO
USE testDB
GO
SET NOCOUNT ON
IF OBJECT_ID('tblLarge') IS NOT NULL
DROP TABLE tblLarge
GO
CREATE TABLE tblLarge
(
xID INT IDENTITY(1, 1) ,
sName1 VARCHAR(100) ,
sName2 VARCHAR(1000) ,
sName3 VARCHAR(400) ,
sIdentifier CHAR(100) ,
dDOB DATETIME NULL ,
nWage NUMERIC(20, 2) ,
sLicense VARCHAR(25)
)
GO
/*********************************
Add 500000 records
**********************************/
SET NOCOUNT ON
INSERT INTO tblLarge
( sName1
,
sName2 ,
sName3 ,
sIdentifier ,
dDOB ,
nWage ,
sLicense
)
VALUES
( LEFT(CAST(NEWID() AS VARCHAR(36)), RAND() * 50) , -- sName1
LEFT(CAST(NEWID() AS VARCHAR(36)), RAND() * 60) , -- sName2
LEFT(CAST(NEWID() AS VARCHAR(36)), RAND() * 70) , -- sName2
LEFT(CAST(NEWID() AS VARCHAR(36)), 2) , -- sIdentifier
DATEADD(dd, -RAND() * 20000, GETDATE()) , -- dDOB
( RAND() * 1000 ) , -- nWage
SUBSTRING(CAST(NEWID() AS VARCHAR(36)), 6, 7) --
sLicense
)
GO 500000
/******************************************************
** Create a clustered index
******************************************************/
ALTER TABLE [tblLarge]
ADD CONSTRAINT [PK_tblLarge]
PRIMARY KEY CLUSTERED ([xID] ASC)
/***************************************************************
** To resolve the sort warning, create a non-clustered index
***************************************************************/
CREATE NONCLUSTERED INDEX [IX_sName1]
ON [tblLarge] ([sName1] ASC)
Simple SELECT Statement:
Following are some simple select statements
to reproduce the behavior.
/******************************************************
** Simple select statement
******************************************************/
--First query
SELECT xID ,
sName1
FROM tblLarge
-- Second query with - ORDER BY
SELECT xID ,
sName1
FROM tblLarge
ORDER BY sName1
-- Third query - GROUP BY/ORDER BY
SELECT sName1 ,
COUNT(sName1) AS nCount
FROM tblLarge a
GROUP BY sName1
ORDER BY sName1
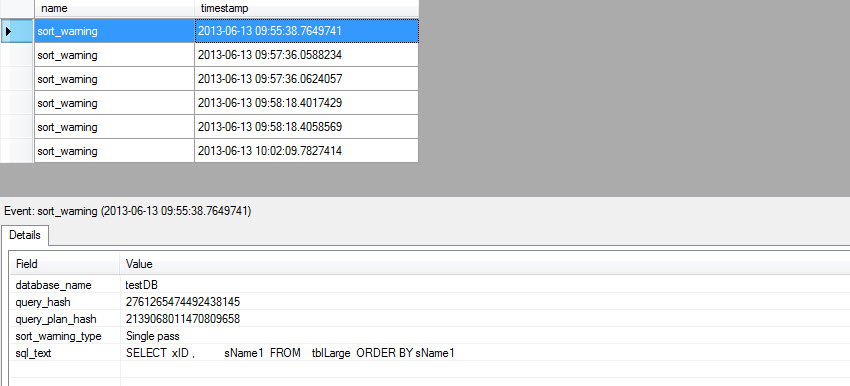
Using
Extended Events (SQL 2012), SQL Profiler Trace and Execution Plan, “sort
warning” are easily detectable and following are some outputs.
Figure#1: sort warning using Extended
Events in SQL 2012
Figure#2A: sort warning detection using
Execution Plan
Figure#2B: sort warning detection using
Execution Plan
Figure#2: sort warning detection using
SQL Profiler Trace
Learn More:
Understanding data vs. log
usage for spills in tempdb
Query Memory Spills
Identifying and Solving Sort
Warnings Problems in SQL Server